
Book Appointment Now

GC INDUS / MANUFACTURING KNOWLEDGE
How to Improve Manufacturing Efficiency on the Shop Floor

Understanding how to improve manufacturing efficiency is essential. Manufacturing efficiency improves on the shop floor when you close the gap between how fast and cheaply you can run a process and how consistently it holds tight tolerances, the two goals reinforce each other when waste, not speed, is the target. Concretely, that means mapping your workflow to find idle time and rework causes, keeping equipment maintained so tolerance drift doesn’t force slowdowns, training operators to catch defects early, and tracking a few clear metrics (cycle time, first-pass yield, OEE) so you know an improvement actually worked before scaling it.

What You’ll Need Before You Improve Manufacturing Efficiency on the Shop Floor
Before changing anything on the floor, gather baseline data, define efficiency in terms that fit a precision shop, and get operators involved from the start, skipping this step is why most efficiency projects stall. This is particularly relevant for how to improve manufacturing efficiency.
For a precision manufacturer, efficiency is not the same as running machines faster or pushing more units out the door. It is throughput and cost per part achieved without sacrificing tolerance. A shop that cuts cycle time by 15% but doubles its scrap rate has not gotten more efficient, it has just moved the cost from the machine to the inspection table and the customer complaint line.
How Manufacturing Efficiency Differs From General Productivity
Productivity counts what you made; efficiency counts what you made correctly relative to what it cost you in time, material, and scrap.
A shop can raise productivity simply by adding a shift or running equipment longer, and output climbs. That says nothing about whether parts are coming off the line right the first time. Efficiency looks at the ratio: good parts per hour of machine time, per kilogram of material, per dollar of labor. Strategies for improving one do not automatically improve the other, and conflating the two is a common reason efficiency initiatives measure the wrong thing from day one.
Why Tight Tolerances Matter When Optimizing for Speed and Cost
Tight tolerances put a ceiling on how far you can push speed or cost before quality, and true efficiency, start to fall.
A faster cycle that increases scrap or rework is not an efficiency gain; it is cost shifted downstream to inspection, rework labor, or a field failure. This is the constraint that makes precision manufacturing different from high-volume commodity work: you cannot chase cycle time in isolation. At GC INDUS, holding tolerances to ±0.001mm across CNC, casting, and molding work means every proposed speed change gets checked against first-pass yield before it’s adopted, not after.
Before you start on how to improve manufacturing efficiency, collect four things: current cycle times for your key operations, scrap and rework rates, machine uptime figures, and a rough process map showing where the bottleneck operation sits. Review the existing workflow before changing it, this baseline is what tells you later whether a change actually worked or just moved the problem.
Finally, involve operators and quality staff from day one, not just management. Floor-level buy-in, along with ongoing training, determines whether a change sticks or quietly reverts within a month.
Identify the Factors Slowing Down Your Shop Floor
Four factors drive most efficiency losses on a precision shop floor: layout and workflow design, equipment condition, operator training, and inventory or workspace organization. Before changing anything, map which of these is actually costing you time.
How Workflow Design, Maintenance, and Training Each Affect the Bottom Line
Poor sequencing is the quiet cost center on most shop floors. When a part travels back and forth between departments because machines aren’t arranged in process order, or waits in a queue between operations, cycle time grows without adding any value to the part. Reviewing the existing workflow before changing equipment or staffing is the first move recommended by most productivity guides, because layout problems often hide behind what looks like a capacity issue.
Equipment condition is the second lever. Unplanned downtime stops production outright, but the more expensive problem is often invisible: worn tooling and neglected machines drift out of tolerance gradually, producing parts that look fine until inspection catches them, or worse, after they’ve shipped. Scheduled, preventive maintenance keeps machines running at rated accuracy and reduces the breakdowns that force last-minute schedule changes.
Workforce training closes the loop. Operators who understand setup procedures, inspection checkpoints, and the real limits of their machines catch drift and setup errors before they turn into scrap. Undertrained staff, by contrast, introduce variability, inconsistent cycle times, inconsistent quality, that no amount of equipment investment fixes on its own. Ongoing training measurably affects output and quality consistency, which is why it shows up as a core productivity lever across manufacturing operations.
The Role of Inventory Management and Workspace Organization
Excess work-in-progress feels like a safety net, but it usually masks a bottleneck somewhere upstream. When WIP piles up in front of one machine or one inspection station, that’s the constraint, carrying extra inventory just delays the point at which you notice it. Tighter inventory management, paired with better scheduling, keeps material moving instead of sitting. When considering how to improve manufacturing efficiency, this point stands out.
Workspace organization has a similar effect at a smaller scale. A shop floor without clear 5S-style organization, tools and fixtures in fixed, labeled locations, adds search time to every changeover and every setup. Multiply a few minutes of searching by dozens of changeovers a week, and organization becomes a measurable drag on throughput, not just a tidiness issue.
Every one of these factors converts directly into overhead. Changeover time, fragmented procurement across too many suppliers, and scrap from undetected tolerance drift all add cost without adding value. That’s precisely why figuring out how to improve manufacturing efficiency starts with an honest audit of these four areas, not with new equipment. At GC INDUS, this discipline, matching workflow, maintenance schedules, and operator training to tolerances as tight as ±0.001mm, is what keeps scrap and rework rates low enough to support flexible order quantities from a single piece up to full production runs.

Measure Whether Your Efficiency Improvements Are Actually Working
Track five metrics before and after every change: cycle time, first-pass yield, scrap rate, machine uptime, and on-time delivery rate. If these don’t move together in the right direction, the change isn’t working, regardless of how it feels on the floor.
Knowing how to improve manufacturing efficiency starts with knowing what “improved” actually looks like in numbers, not impressions from the floor supervisor.
Metrics and Formulas to Track Efficiency Gains and ROI
Each metric reveals a different failure mode, and none of them tells the full story alone.
- Cycle time, the time from start to finish on one part or batch. A drop here signals faster throughput, but only if quality holds.
- First-pass yield, the percentage of parts that pass inspection without rework. This exposes hidden cost that cycle time hides.
- Scrap rate, material and labor lost to unusable parts. Rising scrap alongside falling cycle time means you’re trading speed for waste.
- Machine uptime / OEE (overall equipment effectiveness), the share of planned production time a machine is actually running and producing good parts. Low uptime often points to maintenance gaps or changeover delays rather than the process itself.
- On-time delivery rate, the percentage of orders shipped by the promised date. This is the metric your customer actually feels.
Run a basic before/after test: record baseline values for all five metrics over a defined run, say, 500 parts or two weeks of production. Change one variable, a fixture redesign, a new tool path, a revised inspection step, and remeasure over an equivalent run. Changing two variables at once makes it impossible to know which one moved the needle.
For a simple efficiency ratio, you don’t need software: divide actual output (good parts produced) by resources consumed (machine hours, labor hours, or material used) and compare the ratio before and after the change. A spreadsheet with four columns, date, output, resource hours, and ratio, is enough to spot a real trend over a few weeks.
Setting Realistic Targets for Automotive, Electronics, and Medical Device Work
Targets have to match the part, not a generic industry benchmark. Automotive high-volume runs can often tolerate a slightly higher scrap rate in exchange for faster cycle times, because the cost per part is low and volume absorbs the loss. Low-volume medical device or electronics work runs the opposite tradeoff, tighter inspection requirements and traceability rules mean a faster cycle time that increases scrap or skips a verification step isn’t a gain, it’s a liability. GC INDUS holds ISO 13485 medical device compliance and ±0.001mm tolerances precisely because that segment can’t treat scrap rate as a variable to trade away.
Never chase one metric in isolation. A cycle time improvement that pushes scrap rate up, or an uptime gain that quietly lowers first-pass yield, is not real progress, it’s a cost shifted somewhere you haven’t measured yet.
Apply Practical Methods to Cut Waste and Reduce Production Costs
Cutting waste on the shop floor means picking the right framework for the problem, then following a disciplined sequence: map, target, pilot, measure, standardize. Most guides on how to improve manufacturing efficiency treat Lean, Six Sigma, and Theory of Constraints as competing systems, but a precision shop gets more value by borrowing the piece that fits the problem in front of it.
Comparing Lean, Six Sigma, and Theory of Constraints for Precision Shops
Each framework attacks a different mechanism, and knowing which one matches your problem saves months of misapplied effort. Lean targets waste in flow, excess motion, waiting, overproduction, and unnecessary transport between machines. Six Sigma targets variation and defect reduction, using statistical control to keep a process centered within tolerance instead of drifting toward scrap. Theory of Constraints targets the single bottleneck limiting total throughput, on the logic that improving any station other than the constraint does not raise output.
A CNC shop holding ±0.001mm tolerances often needs all three at different points: Six Sigma to control variation on a grinding operation prone to dimensional drift, Lean to strip out idle time between a turning cell and an inspection station, and Theory of Constraints to identify which single machine caps the whole line’s output. Treating these as a toolkit rather than a doctrine is more realistic than committing the entire operation to one methodology.
What a Realistic Implementation Timeline Looks Like
Improvement work moves in four phases, and skipping any one of them is the most common reason efficiency projects stall. Follow this sequence: For those exploring how to improve manufacturing efficiency, this matters.
- Map the current process. Walk the floor and document the actual sequence of operations, not the one on paper, value stream mapping exposes queues, rework loops, and handoffs that standard work instructions omit.
- Identify the single biggest constraint. Use cycle time data, scrap rates, or machine utilization logs to find the one station actually limiting throughput, rather than spreading effort across every visible inefficiency.
- Pilot one change on that constraint. Test a fixture redesign, a revised changeover sequence, or a tighter statistical process control limit on that single operation before touching anything else.
- Measure against baseline. Compare cycle time, defect rate, and throughput before and after the pilot using the same metrics you captured in step one.
- Standardize, then move to the next constraint. Lock in the change with updated work instructions and operator training before shifting focus, since constraints move once the current one is resolved.
Expect a short initial assessment period, a focused pilot on one line or cell, a broader rollout once results hold, and a formal review before starting the next constraint. Rushing from pilot to facility-wide rollout without a review step is where most efficiency initiatives lose their gains.
Investment scales with shop size and ambition. A small job shop might start with budget-friendly changes, better fixturing, revised work instructions, a whiteboard Kanban system. A larger operation moving toward automation or ERP-integrated scheduling sits at mid-range to premium investment, depending on how much of the software and machine fleet needs replacing versus integrating.
None of this works if quality erodes while speed improves. Cross-reference every efficiency change against existing quality control checkpoints and documented inspection protocols, GC INDUS ties every process change on the shop floor back to ISO 9001-aligned inspection steps, so a faster cycle time never comes at the cost of a tolerance escape. Waste reduction and quality assurance have to move together, not in sequence.
Avoid Common Mistakes When Rolling Out Efficiency Improvements
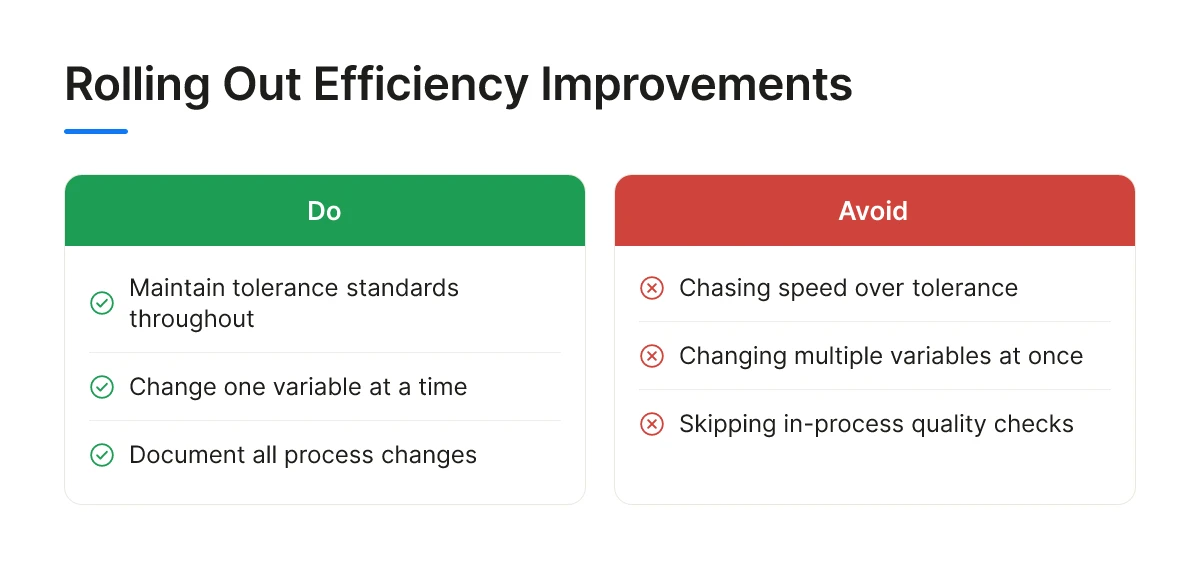
Most failed efficiency projects share the same root causes: chasing speed at the cost of tolerance, changing too many variables at once, and skipping documentation. Recognizing these patterns before you start is central to how to improve manufacturing efficiency without creating new problems.
The most expensive mistake is pushing feed rates up or skipping in-process checks to hit a faster cycle time. A part that runs 15% faster but drifts out of tolerance doesn’t save time, it creates scrap, rework, or a field failure downstream. On tight-tolerance work, the cost of one rejected batch can erase weeks of throughput gains, which is why any speed change needs a matching check at the same or tighter sampling frequency, not a looser one.
A close second is changing multiple variables in the same trial: new tooling, a new fixture, and a revised feed rate all at once. When cycle time improves, nobody can say which change caused it, and when quality drops, nobody can say which change to reverse. Change one variable, measure against your baseline, then move to the next.
IoT and Automation Tools for Real-Time Production Tracking
Sensor-based monitoring earns its keep when it catches tolerance drift or downtime as it happens, rather than at the end of a shift when the scrap bin is already full. Connected sensors on spindles, temperature-sensitive processes, and in-line gauges can flag a dimension trending toward a limit hours before a batch fails final inspection. That shifts quality control from a final gate to a running check, which matters most on high-precision work where a drifting tool can turn good parts into scrap within a handful of cycles.
The failure mode is treating these tools as a dashboard for its own sake, collecting data on a process that isn’t actually the constraint. Real-time monitoring adds cost and complexity; it only pays off when it’s watching the step that determines your overall output.
How to Decide Which Technology Investments Will Pay Off
Prioritize tools that address the bottleneck you identified during measurement, not the operation that looks most impressive on a vendor demo. If your constraint is a manual deburring station, an automated feed system on an upstream CNC mill won’t move your output, it will just build a bigger queue in front of the real problem. Map the investment directly to the bottleneck before committing budget.
Undocumented process changes are the quietest way efficiency gains disappear. An operator adjusts a fixture or a feed rate to fix a problem, doesn’t log it, and the next shift resets the machine to the old parameters, erasing the gain with no record of what happened. At GC INDUS, process changes across CNC, casting, and molding lines get logged as part of the same inspection protocols that support ISO 9001 and ISO 13485 compliance, so a proven adjustment survives the shift change instead of getting quietly reversed.
Frequently Asked Questions
What is the difference between manufacturing efficiency and manufacturing productivity?
Efficiency measures how well you use resources to hit output targets; productivity measures raw output per unit of time or labor, regardless of waste. A shop can be productive but inefficient if it makes parts fast while burning excess material or rework hours. Productive efficiency specifically looks at whether you’re producing at the lowest possible cost without wasting inputs. This directly impacts how to improve manufacturing efficiency outcomes.
How often should you remeasure efficiency metrics after making a change?
Check core metrics like OEE and scrap rate within the first week of a change, then weekly for a month to confirm the trend holds. Short cycles catch backsliding early, before a new bottleneck hides behind normal production variation.
Can small precision shops afford Industry 4.0 monitoring tools?
Yes, many shop floor data collection and ERP integration tools now scale down to smaller operations with budget-friendly tiers rather than enterprise-only pricing. Real-time machine monitoring and third-party software integration no longer require a large capital outlay to start; a shop can begin with a single work-center dashboard and expand once the data proves its value. Start small, measure the return, then scale the tooling to match actual production volume.
Does improving efficiency always mean reducing headcount?
No, most efficiency gains come from cutting wasted material, idle machine time, and rework, not from cutting people. Training and educating employees on process changes and new equipment tends to improve output more reliably than reducing staff, since skilled operators catch quality issues automation alone would miss.
How do you know if a bottleneck has actually moved after a fix?
Track work-in-progress queues at each station for a week; the bottleneck has moved if queue buildup shifts to a different machine or step. If the original station now finishes ahead of schedule while another stage backs up, you’ve relocated the constraint rather than removed it, a normal, expected outcome of process improvement.

Conclusion
Efficiency gains in precision manufacturing come from three habits: measuring before you change anything, fixing the actual bottleneck instead of the most visible one, and rechecking metrics often enough to catch a problem before it compounds. None of this requires replacing your team or your equipment, it requires disciplined measurement and a willingness to act on what the data shows.
If your shop is hitting quality escapes or missed deadlines despite these efforts, the constraint may sit upstream, with a supplier who can’t hold tolerance or consolidate processes. Start by auditing how many vendors touch a single part before it reaches your line, GC INDUS handles CNC machining, casting, molding, and assembly under one roof, from a single prototype to full production runs.
Recommended Articles
Explore more from our content library:


